Information related to Financial Results

Financial Highlights
Highlights
Index on performance / profitability


Indicators on financial condition and efficiency

Per share index

Key Performance / Financial Indicators List
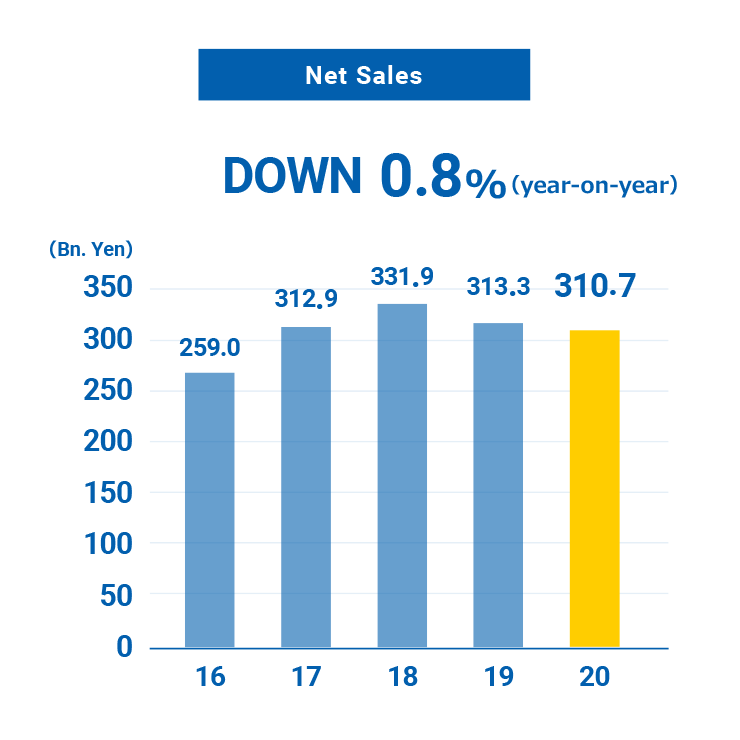
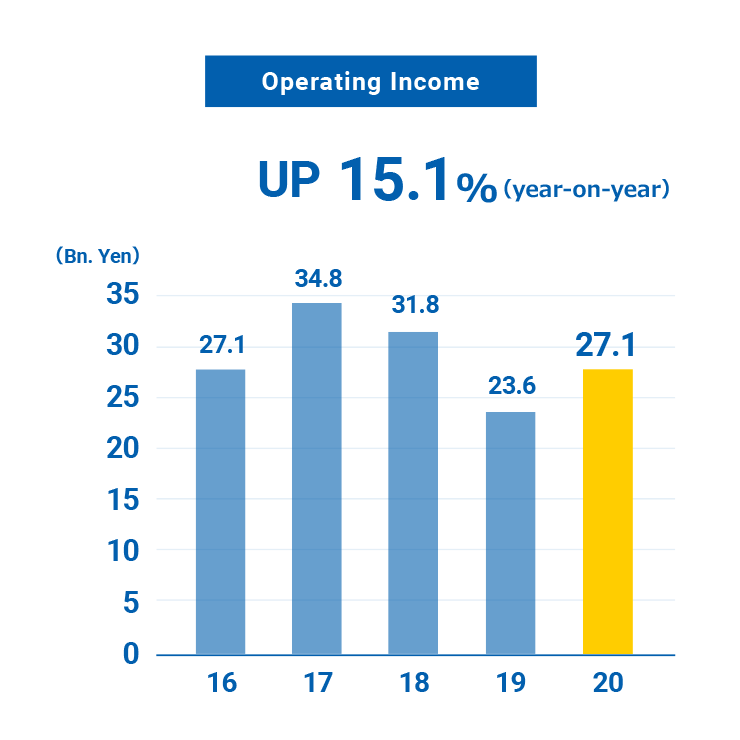
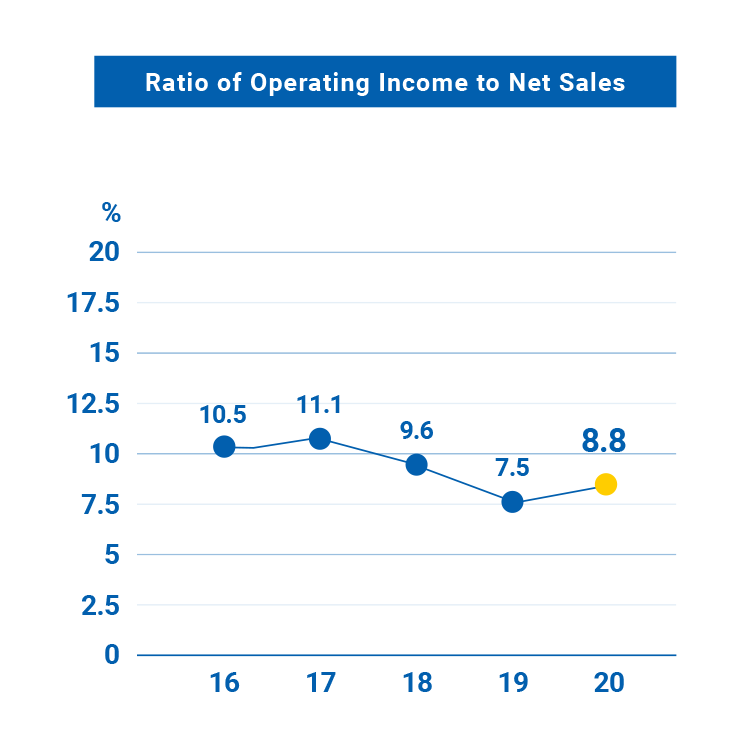
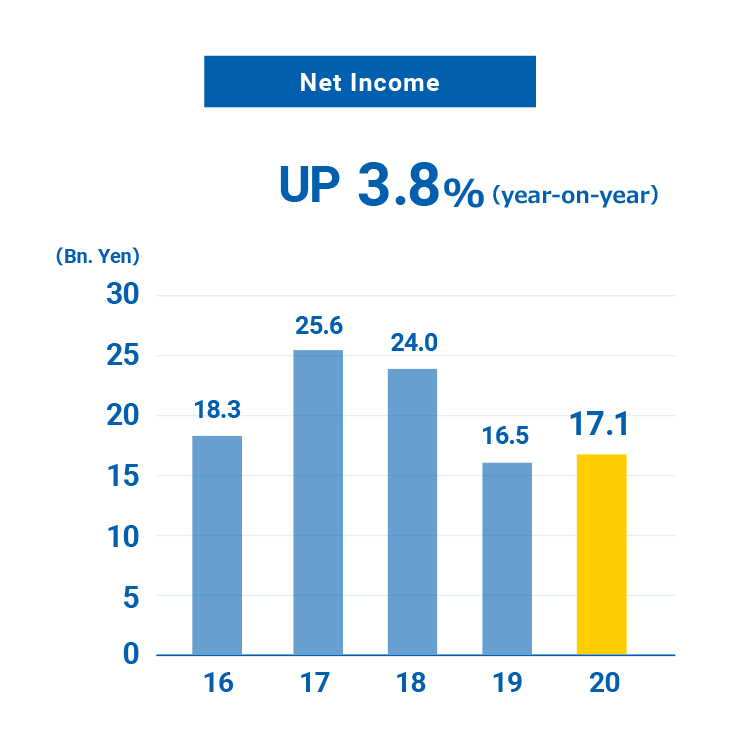
Index on performance / profitability (millions of Yen)
This table can be scrolled horizontally.
| 2016 | 2017 | 2018 | 2019 | 2020 | |
|---|---|---|---|---|---|
| Net sales | 259,015 | 312,969 | 331,936 | 313,337 | 310,719 |
| Operating income | 27,127 | 34,848 | 31,874 | 23,640 | 27,199 |
| ratio of operating income to net sales (%) | 10.5% | 11.1% | 9.6% | 7.5% | 8.8% |
| Net income | 18,387 | 25,601 | 24,034 | 16,504 | 17,138 |
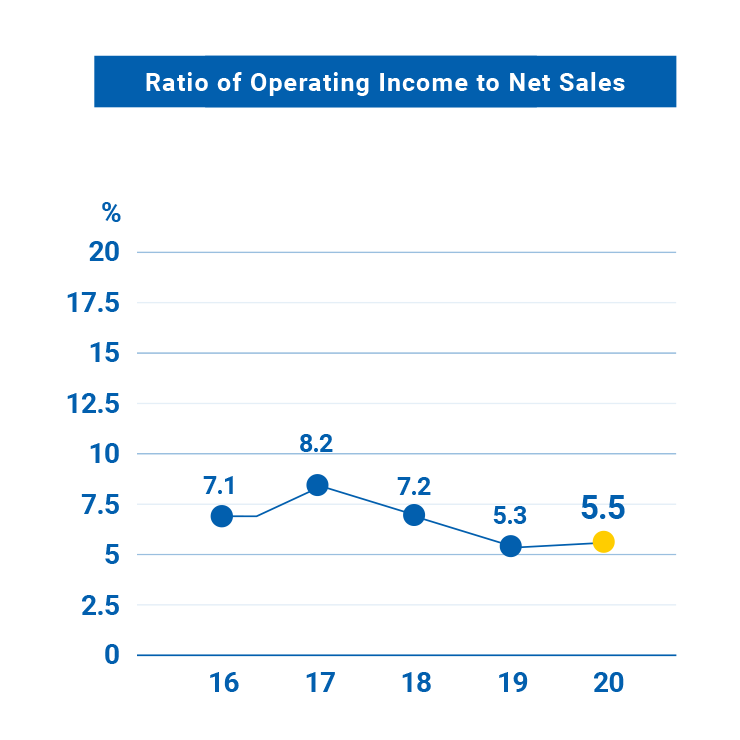
| Ratio of net income to net sales (%) | 7.1% | 8.2% | 7.2% | 5.3% | 5.5% |
Indicators on financial condition and efficiency (millions of Yen)
| 2016 | 2017 | 2018 | 2019 | 2020 | |
|---|---|---|---|---|---|
| Net assets | 212,041 | 243,492 | 252,393 | 264,684 | 288,921 |
| Capital investment | 7,219 | 15,421 | 21,414 | 18,018 | 14,016 |
| Depreciation cost | 5,901 | 7,187 | 8,840 | 13,070 | 14,963 |
| Capital adequacy ratio (%) | 72.9% | 76.1% | 80.6% | 79.2% | 80.0% |
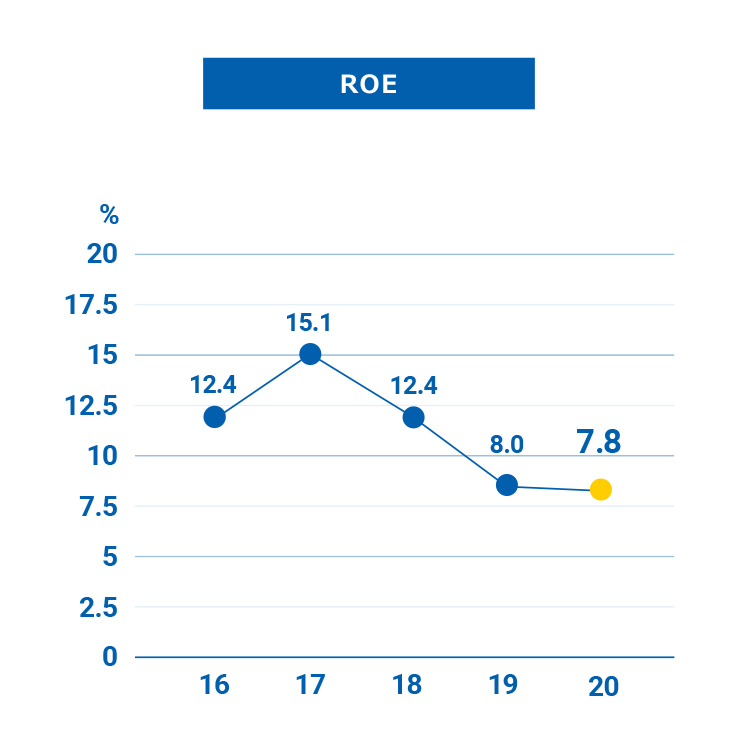
| ROE (%) | 12.4% | 15.1% | 12.4% | 8.0% | 7.8% |
Per share index (yen)
| 2016 | 2017 | 2018 | 2019 | 2020 | |
|---|---|---|---|---|---|
| Net assets per share | 560.79 | 653.71 | 717.56 | 737.99 | 813.57 |
| Net income per share | 66.94 | 91.01 | 84.80 | 58.18 | 60.36 |
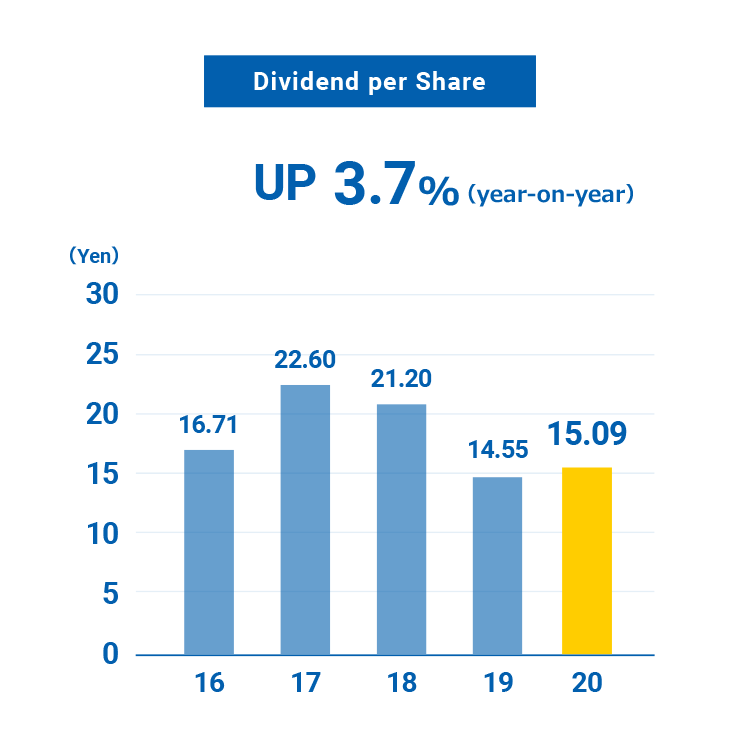
| Dividends per share | 16.71 | 22.60 | 21.20 | 14.55 | 15.09 |
EC website for FA/ Die components, Tools/ MROs etc. Including MISUMI, the number of domestic and overseas manufacturers handled, surpass 3000 companies. Free shipment from even one item order, by way of reliable quick delivery.
E-Commerce website of each respective Sales Area
| Japan | China | Korea | Vietnam |
| Thailand | Singapore | Malaysia | Indonesia |
| India | Germany | Italy | France |
| United Kingdom | USA | Mexico |